|
|
|
|
|
|
|
|
|
|
|
|
|
|
|
|
|
|
|
|
|
|
|
|
|
|
|
|
|
|
|
|
|
|
|
|
|
|
|
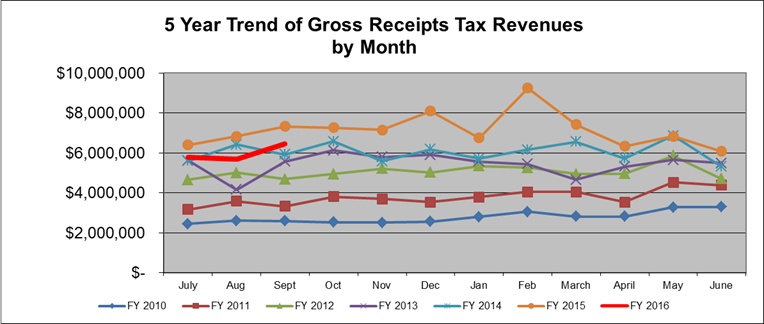
Rows (1-18) show the actual monthly
gross receipts (GRT) collections for the General Fund. In row (21) the average monthly GRT is
calculated for each month. Row (22)
shows |
|
|
|
|
|
|
|
|
|
|
|
|
|
|
|
|
|
|
what percentage of the annual total
each month is for the FY 93-11 period.
February receipts are 9.07% of the annual GRT and it is the highest
single month. March and Jan. |
|
|
|
|
|
|
|
|
|
|
|
|
|
|
|
|
|
|
the least productive GRT
months. Row (25) shows what needs to
be collected in FY 2010 to meet the annual GRT budget if FY 2010 follows the
normal trends shown in row (21) |
|
|
|
|
|
|
|
|
|
|
|
|
|
|
|
|
|
|
Row (28) shows the actual GRT for
each month during FY 2010. Row (31)
shows the projected annual deficit or surplus for FY 2010 based on the actual
GRT received in row (18) |
|
|
|
|
|
|
|
|
|
|
|
|
|
|
|
|
|
|
and the normal trend shown in row
(21). The projections shown in row
(31) are cumulative for the fiscal year.
These projections should not be considered reliable until |
|
|
|
|
|
|
|
|
|
|
|
|
|
|
|
|
|
|
September or October when
three-four months of actual GRT returns are known. |
|
|
|
|
|
|
|
|
|
|
|
|
|
|
|
|
|
|
|
|
|
|
|
|
|
|
|
|
|
|
|
|
|
|
|
|
|
|
July |
Aug |
Sept |
Oct |
Nov |
Dec |
Jan |
Feb |
March |
April |
May |
June |
Total |
|
|
|
|
|
Historical Data: |
|
|
|
|
|
|
|
|
|
|
|
|
|
|
|
|
|
| 1 |
FY 1993 |
$
1,049,860 |
$
1,070,917 |
$
1,017,179 |
$
1,209,973 |
$
967,352 |
$
1,065,448 |
$
1,030,820 |
$
1,118,555 |
$
923,729 |
$
1,251,922 |
$
1,091,188 |
$
1,124,426 |
$
12,921,369 |
|
|
|
|
| 2 |
FY 1994 |
$
1,255,659 |
$
1,219,096 |
$
1,164,751 |
$
1,184,537 |
$
1,120,774 |
$
1,274,187 |
$
1,151,443 |
$
1,461,393 |
$
958,670 |
$
1,203,108 |
$
1,132,366 |
$
1,157,523 |
$
14,283,507 |
|
|
|
|
| 3 |
FY 1995 |
$
1,093,545 |
$
1,053,740 |
$
1,195,967 |
$
1,114,980 |
$
1,075,597 |
$
1,078,587 |
$
1,067,229 |
$
1,414,084 |
$
950,276 |
$
1,268,874 |
$
1,134,320 |
$
1,249,100 |
$
13,696,299 |
|
|
|
|
| 4 |
FY 1996 |
$
1,231,803 |
$
1,247,583 |
$
1,248,731 |
$
1,229,183 |
$
1,257,021 |
$
1,245,837 |
$
1,149,191 |
$
1,407,358 |
$
1,187,513 |
$
1,163,384 |
$
1,250,615 |
$
1,426,738 |
$
15,044,957 |
|
|
|
|
| 5 |
FY 1997 |
$
1,242,449 |
$
1,347,926 |
$
1,382,128 |
$
1,358,148 |
$
1,364,735 |
$
1,295,825 |
$
1,433,949 |
$
1,515,023 |
$
1,255,771 |
$
1,298,505 |
$
1,119,129 |
$
1,574,843 |
$
16,188,431 |
|
|
|
|
| 6 |
FY 1998 |
$
1,496,904 |
$
1,597,051 |
$
1,387,251 |
$
1,323,909 |
$
1,559,593 |
$
1,348,068 |
$
1,467,670 |
$
1,550,608 |
$
1,385,013 |
$
1,584,848 |
$
1,246,537 |
$
1,407,829 |
$
17,355,281 |
|
|
|
|
| 7 |
FY 1999 |
$
1,545,585 |
$
1,492,322 |
$
1,908,511 |
$
1,263,522 |
$
1,369,943 |
$
1,170,055 |
$
1,222,407 |
$
1,302,085 |
$
914,903 |
$
1,333,853 |
$
1,147,445 |
$
1,040,038 |
$
15,710,669 |
|
|
|
|
| 8 |
FY 2000 |
$
1,396,124 |
$
1,169,774 |
$
1,253,549 |
$
1,059,921 |
$
1,102,007 |
$
1,584,896 |
$
1,278,509 |
$
1,261,377 |
$
1,286,597 |
$
1,296,670 |
$
1,205,795 |
$
1,411,725 |
$
15,306,944 |
|
|
|
|
| 9 |
FY 2001 |
$
1,547,415 |
$
1,334,603 |
$
1,594,133 |
$
1,467,172 |
$
1,523,262 |
$
1,475,733 |
$
1,324,361 |
$
1,659,374 |
$
1,407,882 |
$
1,857,586 |
$
1,359,908 |
$
1,913,420 |
$
18,464,849 |
|
|
|
|
| 10 |
FY 2002 |
$
1,963,447 |
$
1,775,214 |
$
1,797,353 |
$
1,714,476 |
$
1,838,860 |
$
1,768,536 |
$
1,445,741 |
$
1,724,230 |
$
1,429,203 |
$
1,481,091 |
$
1,324,605 |
$
1,642,403 |
$
19,905,159 |
|
|
|
|
| 11 |
FY 2003 |
$
1,506,139 |
$
1,736,332 |
$
1,582,355 |
$
1,436,144 |
$
1,519,188 |
$
1,332,489 |
$
1,653,874 |
$
1,670,312 |
$
1,502,270 |
$
1,839,625 |
$
1,428,268 |
$
1,793,555 |
$
19,000,551 |
|
|
|
|
| 12 |
FY 2004 |
$
1,787,179 |
$
1,874,965 |
$
1,740,392 |
$
1,901,724 |
$
1,591,960 |
$
1,853,339 |
$
1,421,207 |
$
2,013,104 |
$
1,751,423 |
$
1,703,668 |
$
1,805,663 |
$
1,832,097 |
$
21,276,721 |
|
|
|
|
| 13 |
FY 2005 |
$
1,854,511 |
$
1,966,942 |
$
1,902,550 |
$
1,934,886 |
$
1,883,358 |
$
1,974,657 |
$
1,909,537 |
$
2,246,326 |
$
1,992,746 |
$
2,325,063 |
$
2,492,341 |
$
2,324,602 |
$
24,807,520 |
|
|
|
|
| 14 |
FY 2006 |
$
2,288,671 |
$
2,528,685 |
$
2,324,564 |
$
2,465,626 |
$
2,655,948 |
$
2,501,298 |
$
2,650,133 |
$
2,958,194 |
$
2,853,114 |
$
2,666,699 |
$
2,851,448 |
$
2,623,388 |
$
31,367,769 |
|
|
|
|
| 15 |
FY 2007 |
$
2,578,140 |
$
3,266,654 |
$
3,178,121 |
$
2,734,679 |
$
3,186,340 |
$
3,218,605 |
$
2,895,925 |
$
3,295,981 |
$
2,984,894 |
$
2,928,949 |
$
3,208,111 |
$
3,135,735 |
$
36,612,132 |
|
|
|
|
| 16 |
FY 2008 |
$
3,264,294 |
$
3,395,406 |
$
3,157,724 |
$
3,255,981 |
$
3,277,893 |
$
3,389,741 |
$
3,179,788 |
$
3,517,675 |
$
3,417,829 |
$
3,311,425 |
$
3,976,623 |
$
3,214,008 |
$
40,358,387 |
|
|
|
|
| 17 |
FY 2009 |
$
3,528,192 |
$
3,905,126 |
$
3,850,785 |
$
3,806,096 |
$
3,989,080 |
$
4,260,188 |
$
3,453,806 |
$
3,905,134 |
$
3,429,054 |
$
2,962,780 |
$
2,951,606 |
$
2,646,555 |
$
42,688,402 |
|
|
|
|
| 18 |
FY 2010 |
$
2,451,199 |
$
2,617,251 |
$
2,599,971 |
$
2,524,216 |
$
2,519,766 |
$
2,569,348 |
$
2,809,350 |
$
3,066,473 |
$
2,817,258 |
$
2,822,733 |
$
3,276,794 |
$
3,305,913 |
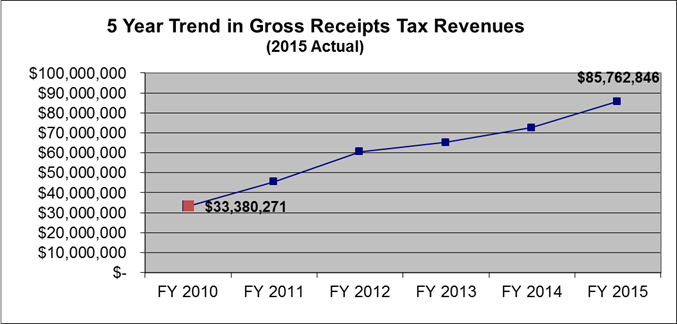
$
33,380,271 |
|
|
|
|
| 19 |
FY 2011 |
$
3,177,097 |
$
3,580,294 |
$
3,335,455 |
$
3,808,790 |
$
3,701,475 |
$
3,538,887 |
$
3,790,904 |
$
4,044,933 |
$
4,057,583 |
$
3,543,250 |
$
4,537,394 |
$
4,391,649 |
$
45,507,712 |
|
$ 0.012500 |
|
|
| 20 |
FY 2012 |
$
4,654,840 |
$
5,017,084 |
$
4,685,581 |
$
4,941,725 |
$
5,217,450 |
$
5,019,105 |
$
5,341,376 |
$
5,265,846 |
$
4,943,766 |
$
4,965,042 |
$
5,863,581 |
$
4,703,418 |
$
60,618,814 |
|
$ 0.012250 |
|
|
| 21 |
FY 2013 |
$
5,626,060 |
$
4,164,833 |
$
5,572,700 |
$
6,132,022 |
$
5,801,762 |
$
5,905,149 |
$
5,571,555 |
$
5,442,808 |
$
4,651,485 |
$
5,308,134 |
$
5,644,374 |
$
5,489,268 |
$
65,310,149 |
|
$ 0.001250 |
|
|
| 22 |
FY 2014 |
$
5,595,087 |
$
6,411,180 |
$
5,917,201 |
$
6,582,812 |
$
5,592,693 |
$
6,172,596 |
$
5,709,227 |
$
6,164,337 |
$
6,554,075 |
$
5,722,893 |
$
6,864,060 |
$
5,314,572 |
$
72,600,732 |
|
$ 0.000625 |
|
|
|
FY 2015 |
$
6,402,668 |
$
6,831,952 |
$
7,322,431 |
$
7,267,059 |
$
7,157,385 |
$
8,099,741 |
$
6,747,068 |
$
9,256,622 |
$
7,424,667 |
$
6,344,409 |
$
6,832,494 |
$
6,076,350 |
$
85,762,846 |
|
|
|
|
|
FY 2016 |
$
5,772,740 |
$
5,699,234 |
$
6,460,706 |
|
|
|
|
|
|
|
|
|
$
17,932,680 |
|
|
|
|
|
|
|
|
|
|
|
|
|
|
|
|
|
|
|
|
$ 0.026625 |
|
|
| 20 |
FY 93-15 |
|
|
|
|
|
|
|
|
|
|
|
|
|
|
|
|
|
| 21 |
Average |
$
2,545,081 |
$
2,634,997 |
$
2,657,364 |
$
2,683,373 |
$
2,664,063 |
$
2,745,318 |
$
2,595,873 |
$
2,924,427 |
$
2,612,162 |
$
2,616,718 |
$
2,771,507 |
$
2,643,441 |
$
32,094,325 |
|
$ 0.001250 |
|
|
| 22 |
% of total |
7.93% |
8.21% |
8.28% |
8.36% |
8.30% |
8.55% |
8.09% |
9.11% |
8.14% |
8.15% |
8.64% |
8.24% |
100% |
|
|
|
|
| 23 |
|
|
|
|
|
|
|
|
|
|
|
|
|
|
|
|
|
|
| 24 |
FY 2016 |
|
|
|
|
|
|
|
|
|
|
|
|
|
|
|
|
|
| 25 |
Prelim. Budget |
$
5,011,762 |
$
5,188,824 |
$
5,232,870 |
$
5,284,086 |
$
5,246,060 |
$
5,406,068 |
$
5,111,781 |
$
5,758,769 |
$
5,143,857 |
$
5,152,829 |
$
5,457,639 |
$
5,205,453 |
$
63,200,000 |
|
|
|
|
| 26 |
|
|
|
|
|
|
|
|
|
|
|
|
|
|
|
|
|
|
| 27 |
FY 2016 |
|
|
|
|
|
|
|
|
|
|
|
|
|
|
|
|
|
| 28 |
Actual |
$
5,772,740 |
$
5,699,234 |
$
6,460,706 |
|
|
|
|
|
|
|
|
|
$
17,932,680 |
|
|
|
|
| 29 |
|
|
|
|
|
|
|
|
|
|
|
|
|
|
|
|
|
|
| 30 |
FY 2016 |
|
|
|
|
|
|
|
|
|
|
|
|
|
|
|
|
|
| 31 |
Proj. Diff. |
$
760,977 |
$
510,410 |
$
1,227,836 |
|
|
|
|
|
|
|
|
|
$
65,699,223 |
Projected |
|
|
|
|
|
|
|
|
|
|
|
|
|
|
|
|
|
|
|
|
|
|
|
|
|
|
|
|
|
|
|
|
|
|
|
|
|
|
|
|
|
|
|
20% |
14% |
15% |
-2% |
16% |
20% |
12% |
31% |
4% |
-4% |
4% |
3% |
|
|
|
|
|
|
|
-13% |
-14% |
3% |
-6% |
-4% |
-15% |
-7% |
-3% |
-1% |
5% |
0% |
8% |
|
|
|
|
|
|
|
13% |
18% |
4% |
10% |
17% |
16% |
8% |
0% |
25% |
-8% |
10% |
14% |
|
|
|
|
|
|
|
1% |
8% |
11% |
10% |
9% |
4% |
25% |
8% |
6% |
12% |
-11% |
10% |
|
|
|
|
|
|
|
20% |
18% |
0% |
-3% |
14% |
4% |
2% |
2% |
10% |
22% |
11% |
-11% |
|
|
|
|
|
|
|
3% |
-7% |
38% |
-5% |
-12% |
-13% |
-17% |
-16% |
-34% |
-16% |
-8% |
-26% |
|
|
|
|
|
|
|
-10% |
-22% |
-34% |
-16% |
-20% |
35% |
5% |
-3% |
41% |
-3% |
5% |
36% |
|
|
|
|
|
|
|
11% |
14% |
27% |
38% |
38% |
-7% |
4% |
32% |
9% |
43% |
13% |
36% |
|
|
|
|
|
|
|
27% |
33% |
13% |
17% |
21% |
20% |
9% |
4% |
2% |
-20% |
-3% |
-14% |
|
|
|
|
|
|
|
-23% |
-2% |
-12% |
-16% |
-17% |
-25% |
14% |
-3% |
5% |
24% |
8% |
9% |
|
|
|
|
|
|
|
19% |
8% |
10% |
32% |
5% |
39% |
-14% |
21% |
17% |
-7% |
26% |
2% |
|
|
|
|
|
|
|
4% |
5% |
9% |
2% |
18% |
7% |
34% |
12% |
14% |
36% |
38% |
27% |
|
|
|
|
|
|
|
23% |
29% |
22% |
27% |
41% |
27% |
39% |
32% |
43% |
15% |
14% |
13% |
|
|
|
|
|
|
|
|
|
|
|
|
|
|
|
|
|
|
|
|
|
|
|
|
| .125% GRT |
$ 277,092 |
$ 550,655 |
$ 860,769 |
$ 860,769 |
$ 860,769 |
$ 860,769 |
$ 860,769 |
$ 860,769 |
$ 860,769 |
$ 860,769 |
$ 860,769 |
$ 860,769 |
|
|
|
|
|
|
|
|
|
|
|
|
|
|
|
|
|
|
|
|
|
|
|
|
|
|
|
|
|
|
|
|
|
|
|
|
|
|
|
|
|
|
|
|
|
Feb 04-Nov 04 |
|
$ 18,648,202 |
|
|
|
|
|
|
|
|
|
|
|
|
|
|
|
|
Feb 05-Nov 05 |
|
$ 23,644,573 |
26.79% |
|
|
|
|
|
|
|
|
|
|
|
|
|
|
|
|
|
|
|
|
|
|
|
|
|
|
|
|
|
|
|
|
|
|
|
|
|
|
|
|
|
|
|
|
|
|
|
|
|
|
|
|
Q1 2005 |
$ 5,185,734 |
|
|
|
|
|
|
|
|
|
|
|
|
|
|
|
|
|
Q2 2004 |
$ 5,341,428 |
|
|
|
|
|
|
|
|
|
|
|
|
|
|
|
|
|
Q3 2004 |
$ 5,724,003 |
|
|
|
|
|
|
|
|
|
|
|
|
|
|
|
|
|
Q4 2004 |
$ 5,792,902 |
|
|
|
|
|
|
|
|
|
|
|
|
|
|
|
|
|
Q1 2005 |
$ 6,148,609 |
|
|
|
|
|
|
|
|
|
|
|
|
|
|
|
|
|
Q2 2005 |
$ 7,142,006 |
|
|
|
|
|
|
|
|
|
|
|
|
|
|
|
|
|
Q3 2005 |
$ 7,141,920 |
|
|
|
|
|
|
|
|
|
|
|
|
|
|
|
|
|
|
|
|
|
|
|
|
|
|
|
|
|
|
|
|
|
|
|
|
|
|
|
|
|
|
|
|
|
|
|
|
|
|
|
|
|
|
|
|
|
|
|
|
|
|
` |
|
|
|
|
|
|
|
|
|
|
|
|
|
|
|
|
|
|
|
|
|
|
|
|
|
|
|
|
|
|
|
|
|
|
|
|
|
|
|
|
|
|
|
|
|
|
|
|
|
|
|
|
|
|
|
|
|
|
|
|
|
|
|
|
|
|
|
|
|
|
|
|
|
|
|
|
|
|
|
|
|
|
|
|
|
|
|
|
|
|
|
|
|
|
|
|
|
|
|
|
|
|
|
|
|
|
|
|
|
|
|
|
|
|
|
|
|
|
|
|
|
|
|
|
|
|
|
|
|
|
|
|
|
|
|
|
|
|
|
|
|
|
|
|
|
|
|
|
|
|
|
|
|
|
|
|
|
|
|
|
|
|
|
|
|
|
|
|
|
|
|
|
|
|
|
|
|
|
|
|
|
|
|
|
|
|
|
|
|
|
|
|
|
|
|
|
|
|
|
|
|
|
|
|
|
|
|
|
|
|
|
|
|
|
|
|
|
|
|
|
|
|
|
|
|
|
|
|
|
|
|
|
|
|
|
|
|
|
|
|
|
|
|
|
|
|
|
|
|
|
|
|
|
|
|
|
|
|
|
|
|
|
|
|
|
|
|
|
|
|
|
|
|
|
|
|
|
|
|
|
|
|
|
|
|
|
|
|
|
|
|
|
|
|
|
|
|
|
|
|
|
|
|
|
|
|
|
|
|
|
|
|
|
|
|
|
|
|
|
|
|
|
|
|
|
|
|
|
|
|
|
|
|
|
|
|
|
|
|
|
|
|
|
|
|
|
|
|
|
|
|
|
|
|
|
|
|
|
|
|
|
|
|
|
|
|
|
|
|
|
|
|
|
|
|
|
|
|
|
|
|
|
|
|
|
|
|
|
|
|
|
|
|
|
|
|
|
|
|
|
|
|
|
|
|
|
|
|
|
|
|
|
|
|
|
|
|
|
|
|
|
|
|
|
|
|
|
|
|
|
|
|
|
|
|
|
|
|
|
|
|
|
|
|
|
|
|
|
|
|
|
|
|
|
|
|
|
|
|
|
|
|
|
|
|
|
|
|
|
|
|
|
|
|
|
|
|
|
|
|
|
|
|
|
|
|
|
|
|
|
|
|
|
|
|
|
|
|
|
|
|
|
|
|
|
|
|
|
|
|
|
|
|
|
|
|
|
|
|
|
|
|
|
|
|
|
|
|
|
|
|
|
|
|
|
|
|
|
|
|
|
|
|
|
|
|
|
|
|
|
|
|
|
|
|
|
|
|
|
|
|
|
|
|
|
|
|
|
|
|
|
|
|
|
|
|
|
|
|
|
|
|
|
|
|
|
|
|
|
|
|
|
|
|
|
|
|
|
|
|
|
|
|
|
|
|
|
|
|
|
|
|
|
|
|
|
|
|
|
|
|
|
|
|
|
|
|
|
|
|
|
|
|
|
|
|
|
|
|
|
|
|
|
|
|
|
|
|
|
|
|
|
|
|
|
|
|
|
|
|
|
|
|
|
|
|
|
|
|
|
|
|
|
|
|
|
|
|
|
|